Estimate Your Heart Rate for a Given Running Power.
Oct 25, 2021
6 mins read
Power Tool now includes a heart rate calculator from the running power. It allows to visualize the heart rate of a power maintained during 4 minutes. 4 minutes corresponds to a prolonged effort and can be extrapolated over much longer periods.
For shorter times, the heart rate for a certain power is difficult to represent. Indeed, a short acceleration creates a non-immediate variation (partly also caused by the sensor) and it depends in principle on:
- Power before acceleration
- The latency time of the organism
- The duration of the acceleration
- Its intensity
All this complicates things…
The calculation is made from a model whose parameters are determined during the running session.
The model1 used is:
$$ HR = a + b \times Power + c \times \log( Power + 1 ) + d \times Var( Power )$$
a, b, c, and d are calculated in such a way as to minimize the difference with the set of measurements made during the races. Power is the power held for 4 minutes and Var(Power) is its variance.
In principle, if the pace is very regular Var(Power) can be considered as null.
Usage
Setup
The first thing to do is to feed the algorithm with data. To do this, it is not necessary to follow a specific calibration procedure. Following a classic training plan is sufficient. We can consider that the analysis begins to give sufficiently precise results after a mix of two or three easy runs, two or three intervals and two or three fartlek. Basically after two weeks of a workout plan the computation should be reliable.
The first 10 minutes are not taken into account because during the warm-up, the heart rate is generally not very significant. The algorithm weights the newest data to ignore progressively the oldest one. This permits to stay accurate with the current fitness.
Do not forget to think about the quality of the measurements made. The wrist heart rate monitor is unreliable due to its high latency, and in my case, it tends to produce spikes when not placed correctly. In this case, it is better to use a cardio belt to avoid erroneous measurements.
For the power, it is less critical but I still recommend to deactivate the algorithm in trail runs. During a trail run, the effort is sometimes very irregular. I have the impression that in this situation the Stryd sensor is not really delivering accurate data. And also when walking, I’m not sure if the power is as precise as when running.
That said, you should not be paranoid, few measurement errors have no impact on the final result, you just have to avoid systematic and excessive errors.
Interface
Once the running application (with the Power Tool data field) has started, a notification with a link to the analysis pops up on the phone.
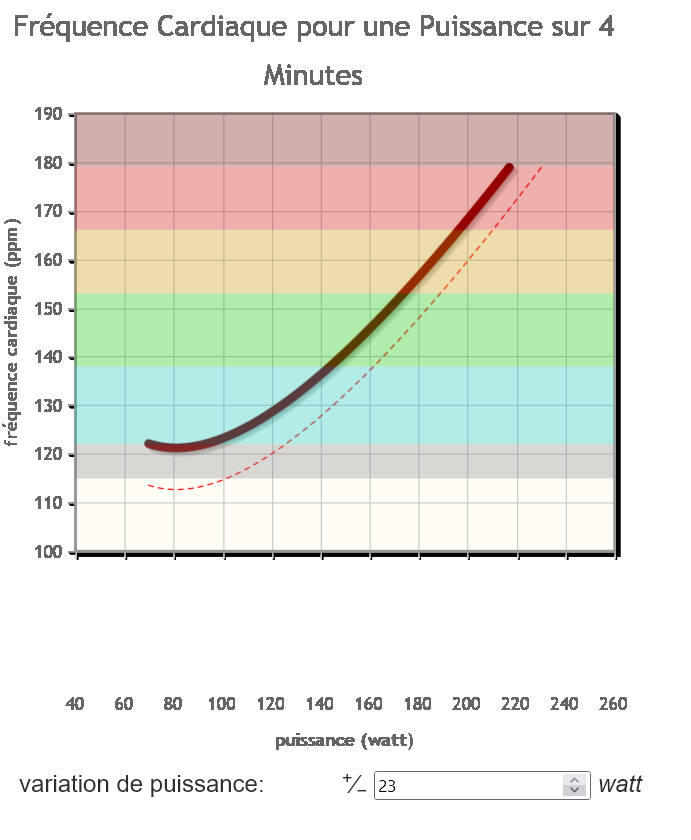
The dotted curve corresponds to the situation of a race where the power is maintained in a constant manner. The other curve is the one with an average power variation (here 23 watts).
In general, for a session at constant speed, we can assume power variation is close to zero. For the 30/30 interval, we can consider that the variation in power is half of the difference between the intense phase and the recovery phase. (So for 180w recovery and 250w sprints we would have a variation of (250-180) / 2 = 35w)
Here is an example of the result.
Determination the vVO2max
The vVO2max, velocity at maximal oxygen uptake, is nothing more than the speed that can be maintained at its maximum oxygen consumption (VO2max). Generally speaking, oxygen consumption during a race is correlated with heart rate. The more you ventilate, the more the heart rate increases to bring oxygen to the muscles. Determining your vVO2max then consists in finding your speed at the maximum frequency that you can run. This is, in general, the maximum heart rate. Thanks to the power/heart rate curve, it is easy to determine its maximum aerobic power, then deduce the pace for it and convert it into a speed. This speed is precisely the vVO2max.
It turns out that I had done a Conconi test 6 months ago and I got a pace of 4:30min/km or 13.3km/h. My maximum heart rate is 179 pulses, using the calculator I find that it corresponds to a power of 231w maintained for 4 minutes. 231w corresponds to a track speed of 4:29min/km.
We see that the two results are consistent.
The advantage is that you can determine your vVO2max without having to do a Conconi or Cooper test. Just follow your training plan and watch after a few sessions find the power at the maximum heart.
Power Zones
Another possible application of heart rate knowledge for a given power is in the definition of the power zones.
Stryd defines its power zones from the critical power. The limits are only a fixed percentage of it.
| Zone | Range |
|---|---|
| Easy | 65%-80% CP |
| Moderate | 80%-90% CP |
| Threshold | 90%-100% CP |
| Interval | 100%-115% CP |
| Repetition | >115% CP |
This definition of zones is purely arbitrary and I find it difficult to interpret. To be clear, if I run with friends and we start a long 4 km climb at 115% CP, what conclusion can I make? I will hold on without collapsing? This situation is a classic in trail running.
If now, we decide to replace the limit of this zone by the power
at maximum frequency maintained for at least 4 minutes, I have information
much more relevant.
I know then that if I’m over this limit, I won’t be able to
maintain the pace for only one or two minutes. And exactly at this limit, I am able to
run approximately ten minutes.
Also, since the critical power is the power that can be held over one hour, we
have then a second threshold which corresponds to an effort that we manage to hold
at least ten minutes.
I think it simplifies analysis during the effort.
We are then left with the following areas:
| Zone | Range |
|---|---|
| Easy | 65%-80% CP |
| Moderate | 80%-90% CP |
| Effort less than one hour | 90%-100% CP |
| Effort less than ten minutes | 100% CP - 100% HR |
| Intense effort | >100% HR |
-
For additional information: Heart Rate Estimation From Running Power. ↩︎
Sharing is caring!